The Carrier Report
Learn about your appointed carriers, or your competition. Identify strengths & weaknesses.

Written by rob g
Updated at March 29th, 2023
In this category:
Table of Contents
The Carrier Report enables wide visibility into a particular Carrier Group at a national or state level. See growth or decline at the state and industry level, who they've won and lost business to, rate trends and more.
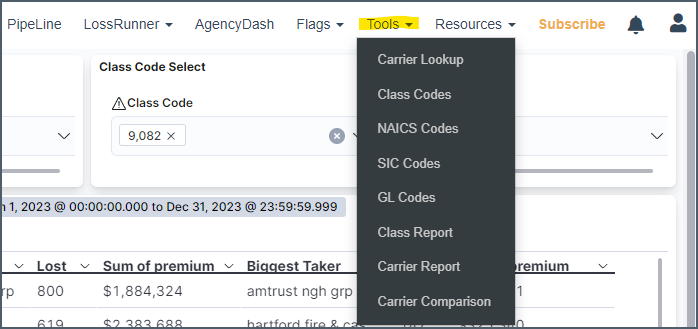
Access from the Tools drop down - https://www.insurancexdate.com/carrier-report.php
Notes on Filtering:
Use class or sic code, but not both at the same time. Doing so just eliminates the states without a class code.
20 states have class code data, 28 have SIC code, 24 have LCM filings and 7 have premium (8 including NJ, which has it for Assigned Risk).
Data availability by State: https://kb.insurancexdate.com/en_US/commercial-reports/commercial-data-availability
Class code will provide data exactly specific to the class you're interested in (and class is what is used to price), SIC will typically provide a broader result (because all states have SIC code data).
You must include commas (,) in the class or sic code (i.e. 9,082).
It is easier to input a code first, and remove the existing code. If you remove the existing code first, you'll need to wait for the results to update before you can enter the new code.
State Level Renewal Volume
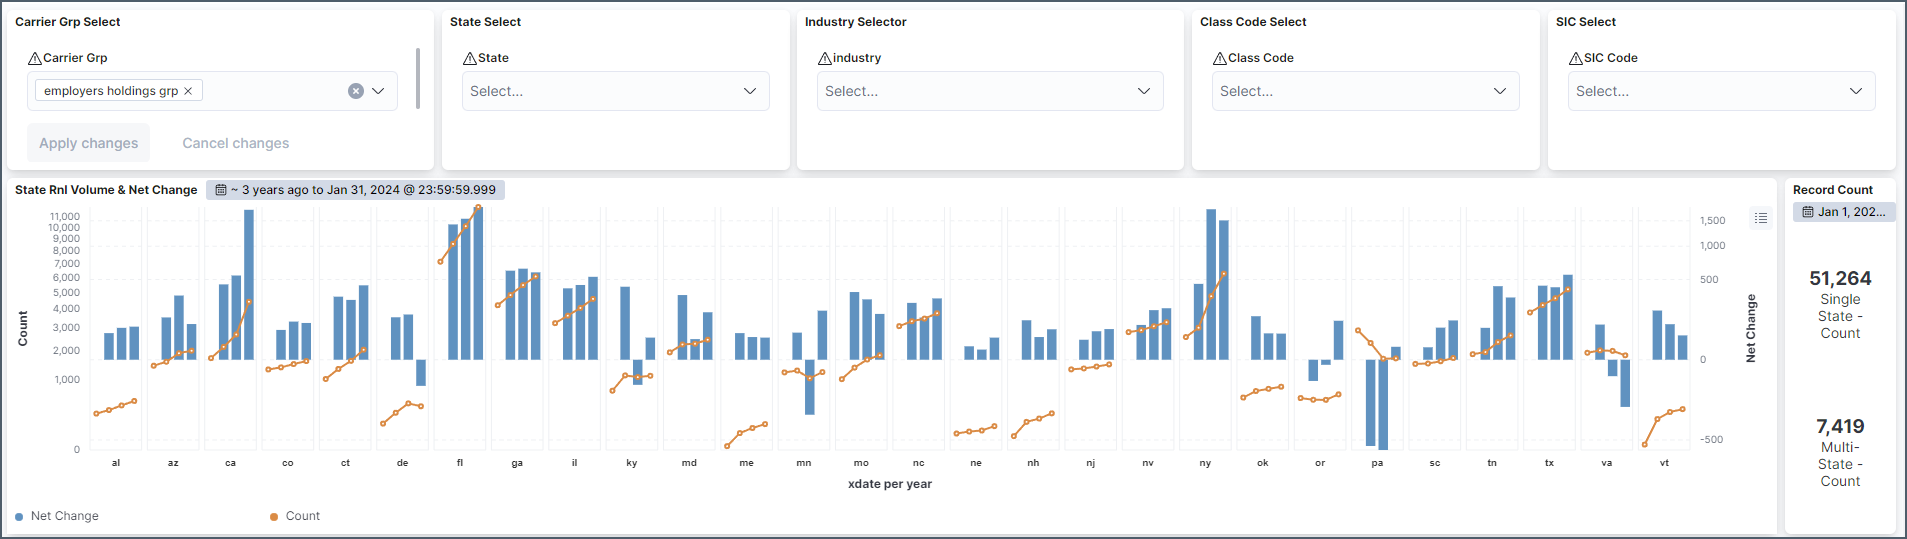
At the top is a year over year trend (line) and net change (bar) graph broken down by state. To the right is a total annual count. Single state records mean the business has coverage in one state, multi-state means they are businesses with coverage in two or more states.
Won/Lost, Industry & Class Breakdown
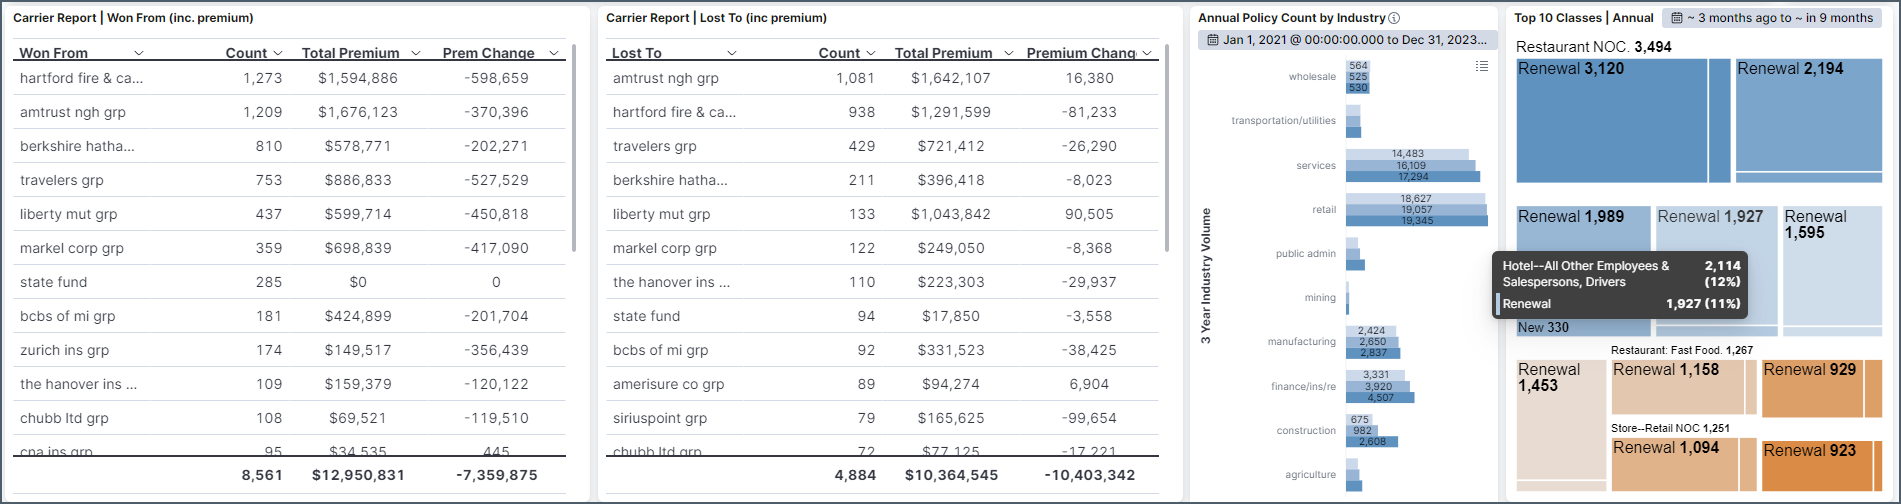
The won and lost reports are straight-forward, a count of what they've won and what they've lost to another carrier. Right of that is annual policy count by industry for a 3 year period. The Tree map shows the top 10 classes (based on volume) split between renewals and new business.
LCM Data
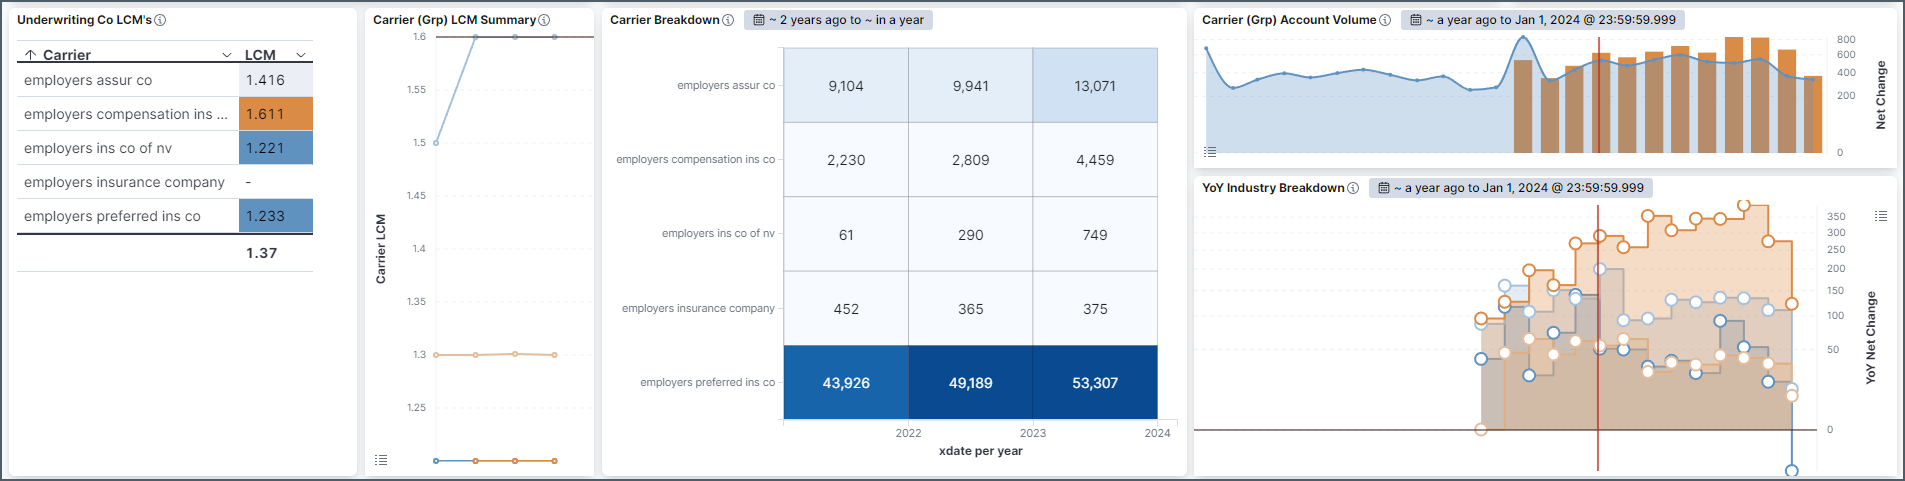
This section breaks down underwriting companies within the group. Note the LCM's are the 'average' so you will need to drill down to the state level to see exactly what they're using. To the right is their monthly volume, broken down by industry below, where you may see net losses that are washed out on the surface.
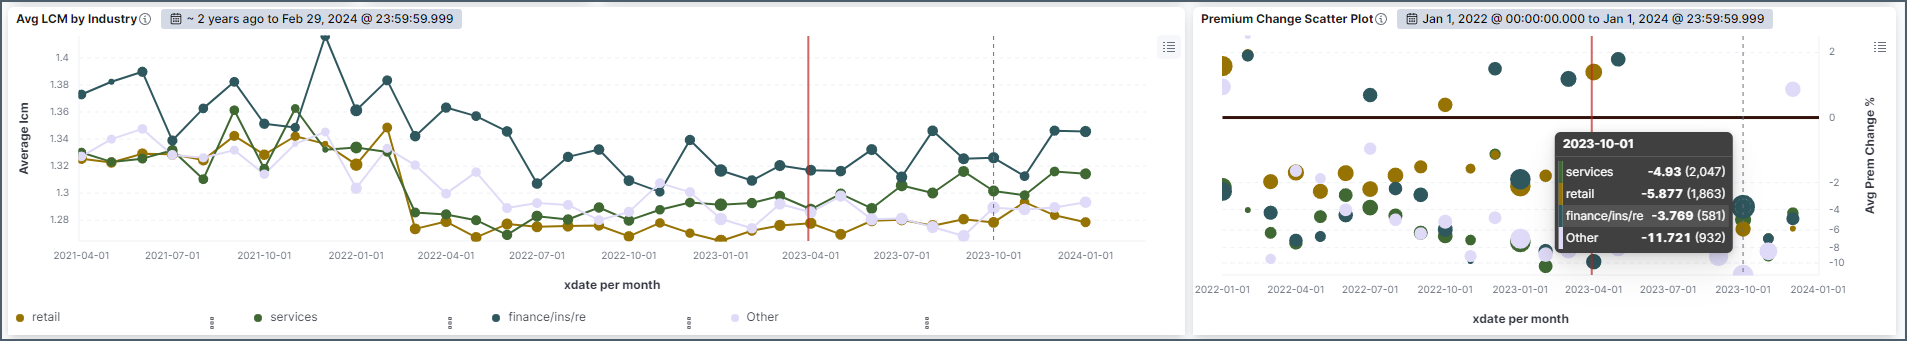
Below is the average LCM filing used broken down by industry. On the right is the premium percentage change, also broken down by industry.
Premium & LCM Change
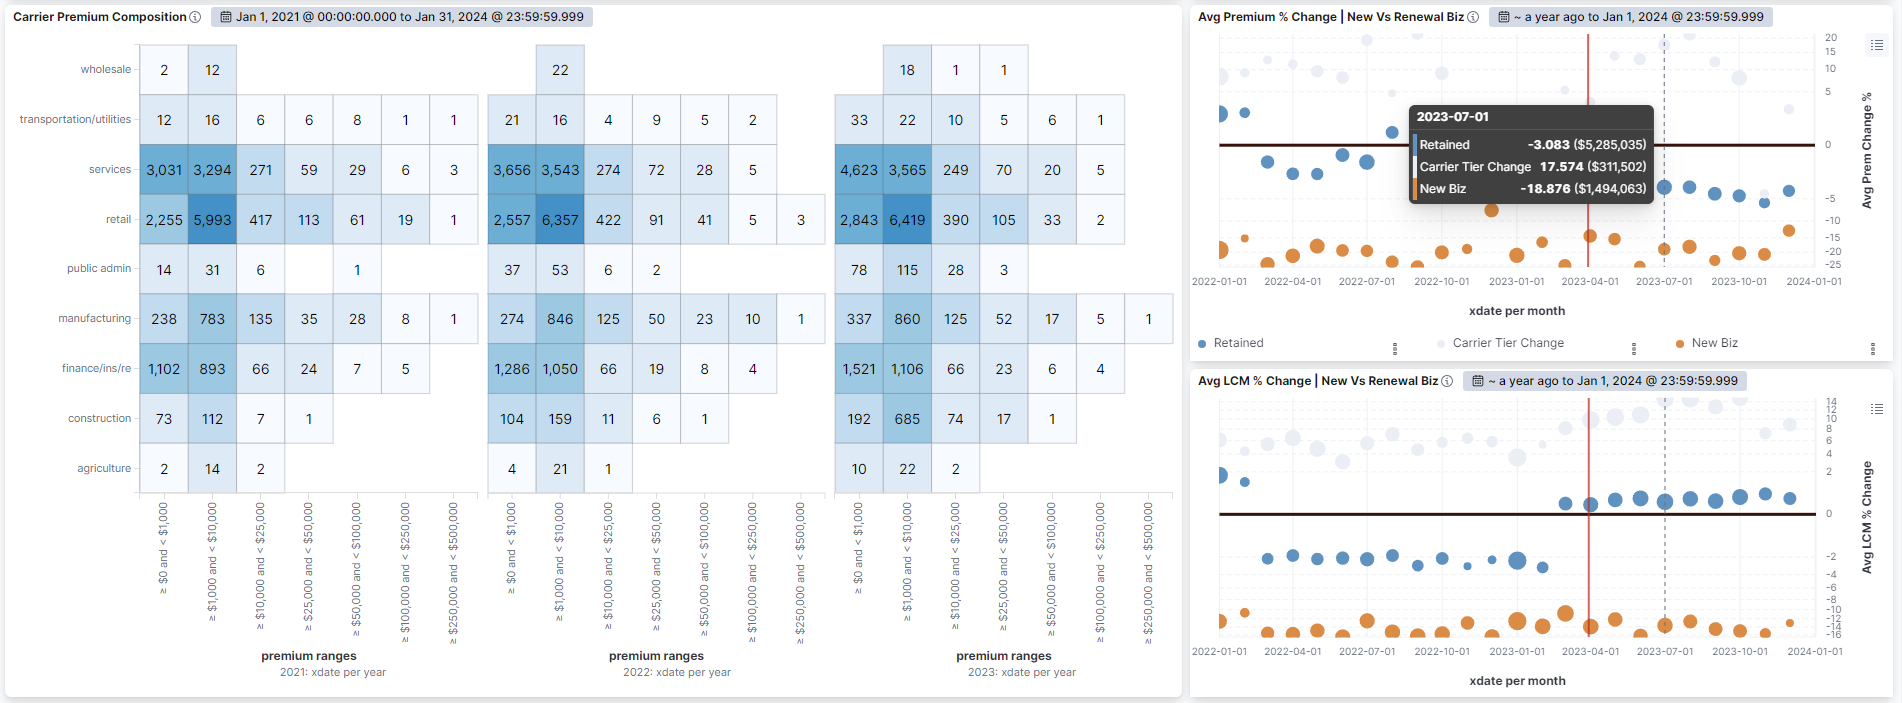
Premium composition shows the annual change in policy count broken down by premium bracket. on the right are the percentage change charts for Premium and LCM, broken down by new biz and renewal.