The Class Report
Check out the top markets, rate trends and more for class codes of interest.
In this category:
Table of Contents
The Class Report enables wide visibility into a particular Class or SIC code at a national or state level. Find the top writers, who's won or lost the most, what their monthly rate trends look like, and more.
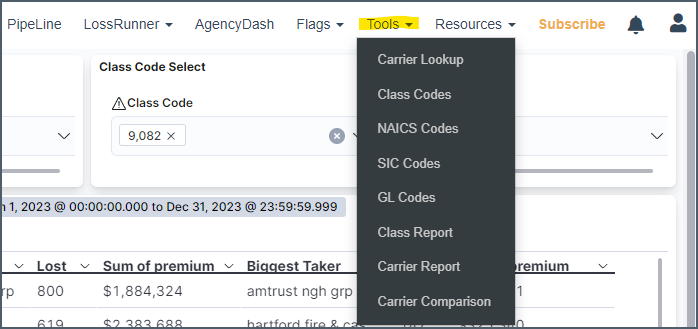
Access from the Tools drop down - https://www.insurancexdate.com/class-report.php

Notes on Filtering:
Use class or sic code, but not both at the same time. Doing so just eliminates the states without a class code.
20 states have class code data, 28 have SIC code, 24 have LCM filings and 7 have premium (8 including NJ, which has it for Assigned Risk).
Data availability by State: https://kb.insurancexdate.com/en_US/commercial-reports/commercial-data-availability
Class code will provide data exactly specific to the class you're interested in (and class is what is used to price), SIC will typically provide a broader result (because all states have SIC code data).
You must include commas (,) in the class or sic code (i.e. 9,082).
It is easier to input a code first, and remove the existing code. If you remove the existing code first, you'll need to wait for the results to update before you can enter the new code.
Class Summary

Class Summary data is displayed at the top. Single state records mean the business has coverage in one state, multi-state means they are businesses with coverage in two or more states.
Retention, New Biz & Lost

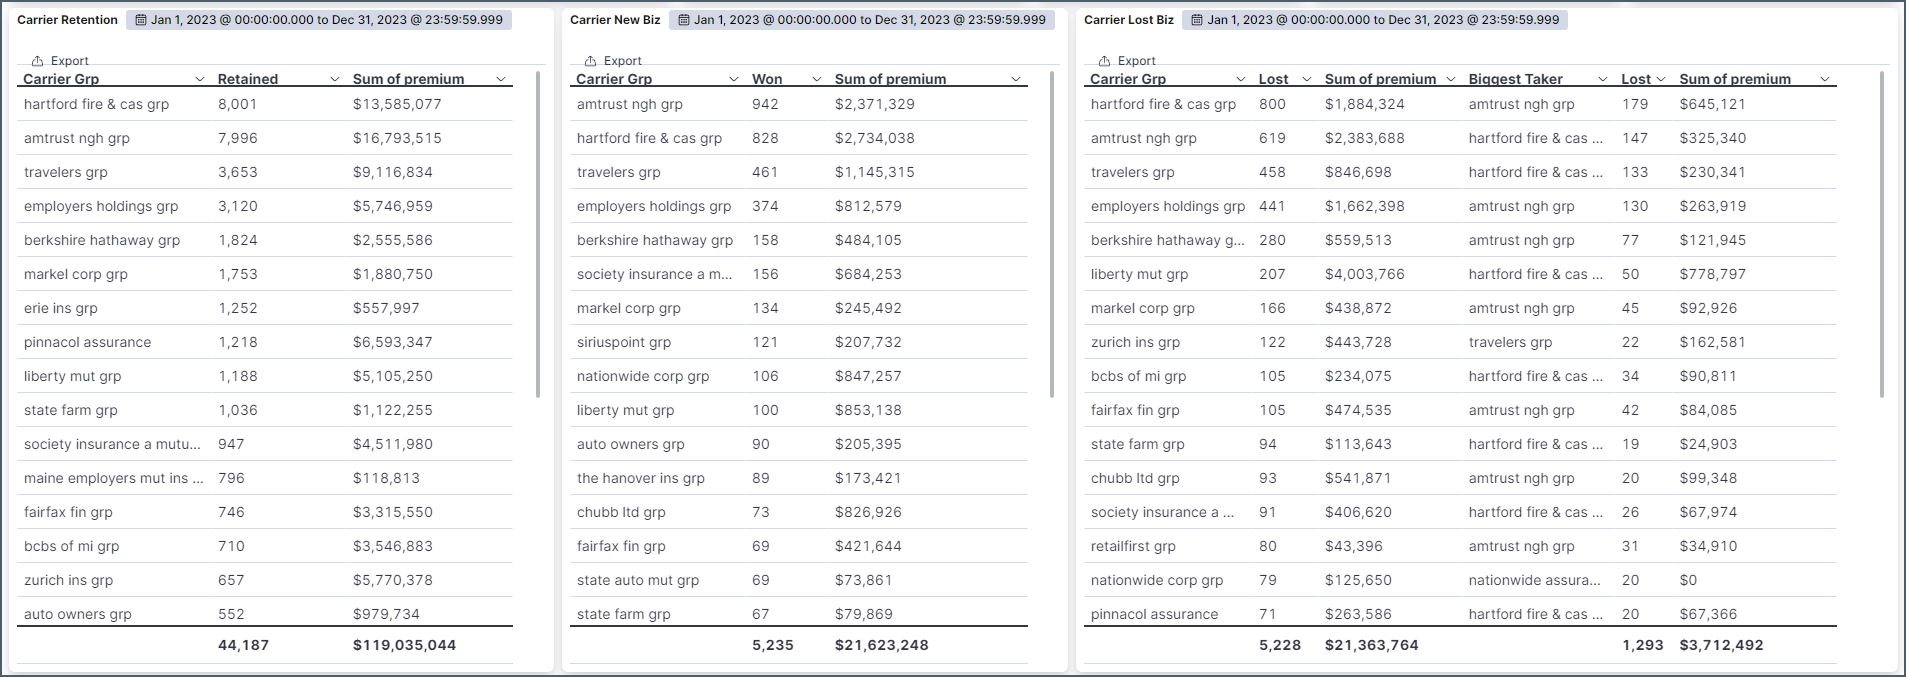
Retention is the total number of renewals retained by the listed carrier group from the prior year. New Biz totals the accounts the carrier has taken from another and Lost Biz totals what they've lost for the class you are viewing. This report also indicates the 'biggest taker' which is the carrier that has taken the most accounts.
LCM/Rate Filings

This section shows the average LCM % change from the prior term in an annualized bar graph, and a monthly line/dot trend. The businesses are split into New Biz and Renewal cohorts. Is the carrier more or less competitive on new biz, or how willing do they look to defend a renewal, can be seen here.

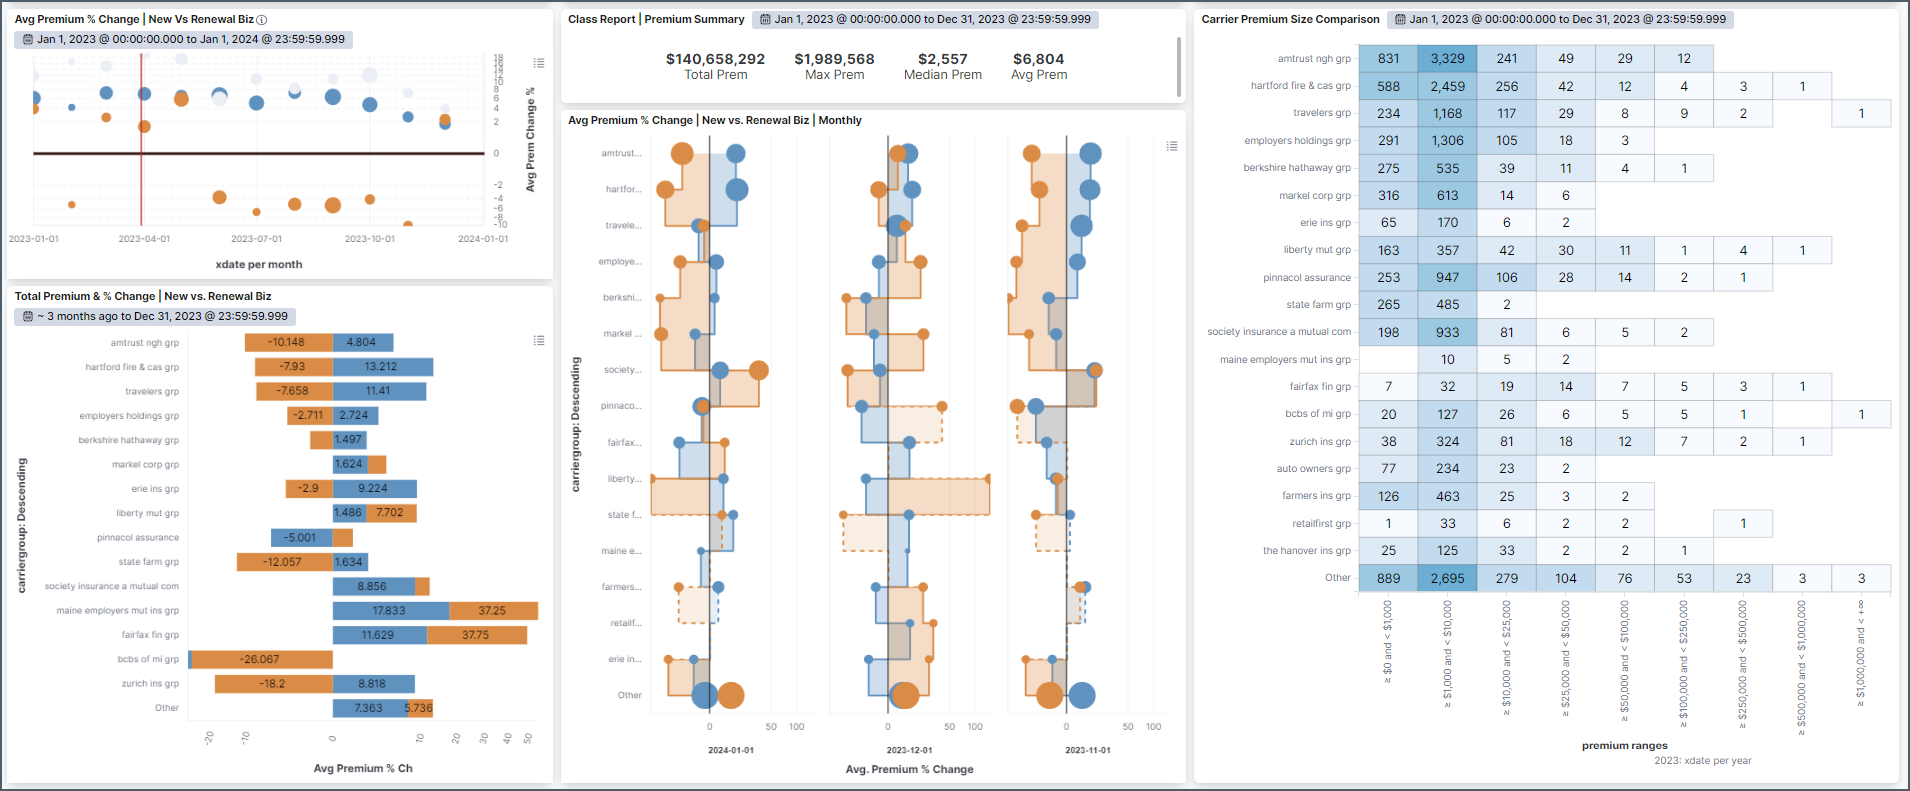
Below that is rate/LCM filing information at the market level. The dot trend indicates % change for businesses that switched carrier groups, those that renewed, and those that were bumped to a different underwriting company (renewed but at a different rate). In the middle is summary info for rates and a monthly trend with year over year change. To the right are the top 20 carriers LCM filings used for the class of business, tiered from lowest to highest.
Premium Trends

These reports are similar but focus on premium. The dot chart trends the businesses' percentage change in premium when they change carriers vs renewing. Our bar graph is an annual look at the change by carrier, with a monthly view in the middle. The premium size comparison breaks down number of accounts by premium bracket to get an idea of market segment.