In this category:
Table of Contents
Overview
The class report focuses on the carriers writing this class in your state - retention, new biz and lost biz. It provides annual trends at the carrier group level, indicating the net change in volume year over year to spot the winners and losers over time for the top 10/15 carrier groups. Depending on the state you are in it will also include net premium trends on an annual basis including the % change in premium written, and net premium and change. Also when LCM filings are available, you can view statistical info for the class (max/min/avg/etc), average LCM trend and year over year change, as well as the top carrier groups filing availability.
Retention, New Biz & Lost Biz

These reports are pretty straight forward - over the last 12 months how many businesses in this prospect's class and state have been retained by the incumbents. How many have been won, and how many were lost. Lost Biz also includes the 'biggest taker' - who they lost the most business to.
If premium is available you will also have visibility into the net premium change for retention, which may indicate a rate increase in the case of increased premium or fighting off competition in the case of a decreased premium change. While we can't definitely answer if an increase came from more prudent underwriting or simply increased exposure basis, it is an insight worth investigating.
New and lost biz will include the sum of premium written for the accounts. Lost biz will also indicate the 'biggest taker' (i.e. who took the most from the carrier) and the total of that premium. Using the above as an example, we can see hartford lost 135 records, while only gaining 97, Travelers taking the most from them. This may indicate a favorable match-up for your new business endeavors.
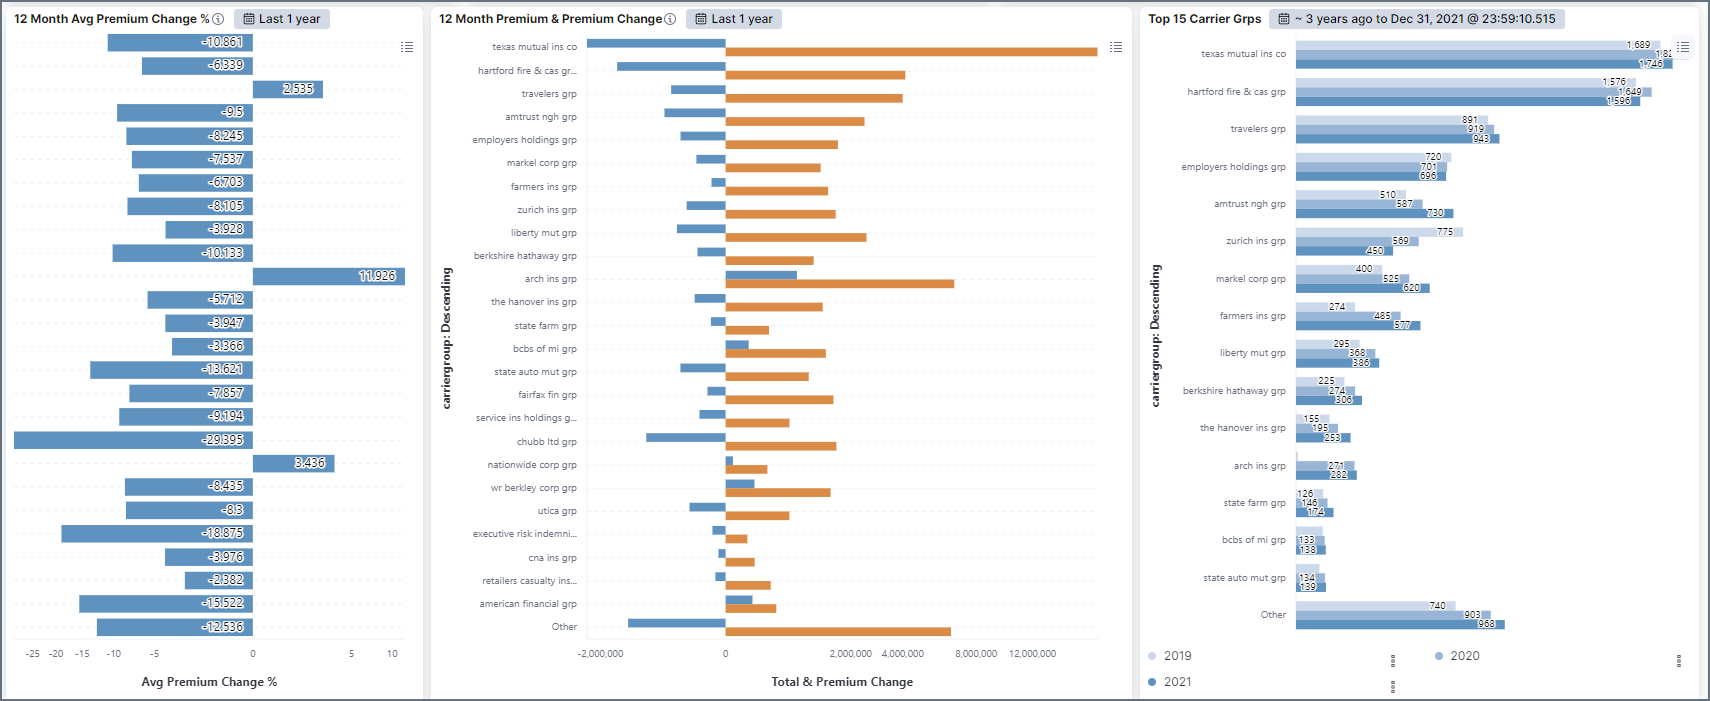
WC Premium Analysis (select states)

When available you will see the average premium % change for a rolling 12 month period as compared to the previous 12 months. The Center chart will display a rolling 12 months of premium written along with the net change from the prior 12 months.
LCM Analysis (select states)

When available you will see statistical info to the left, the center chart providing an average LCM trend in conjunction with the average change and to the right a matrix summarizing the carrier groups writing the class and their LCM capabilities for the class. The color-coding indicating how good, or bad, the filings are relative to the market.