In this category:
Overview

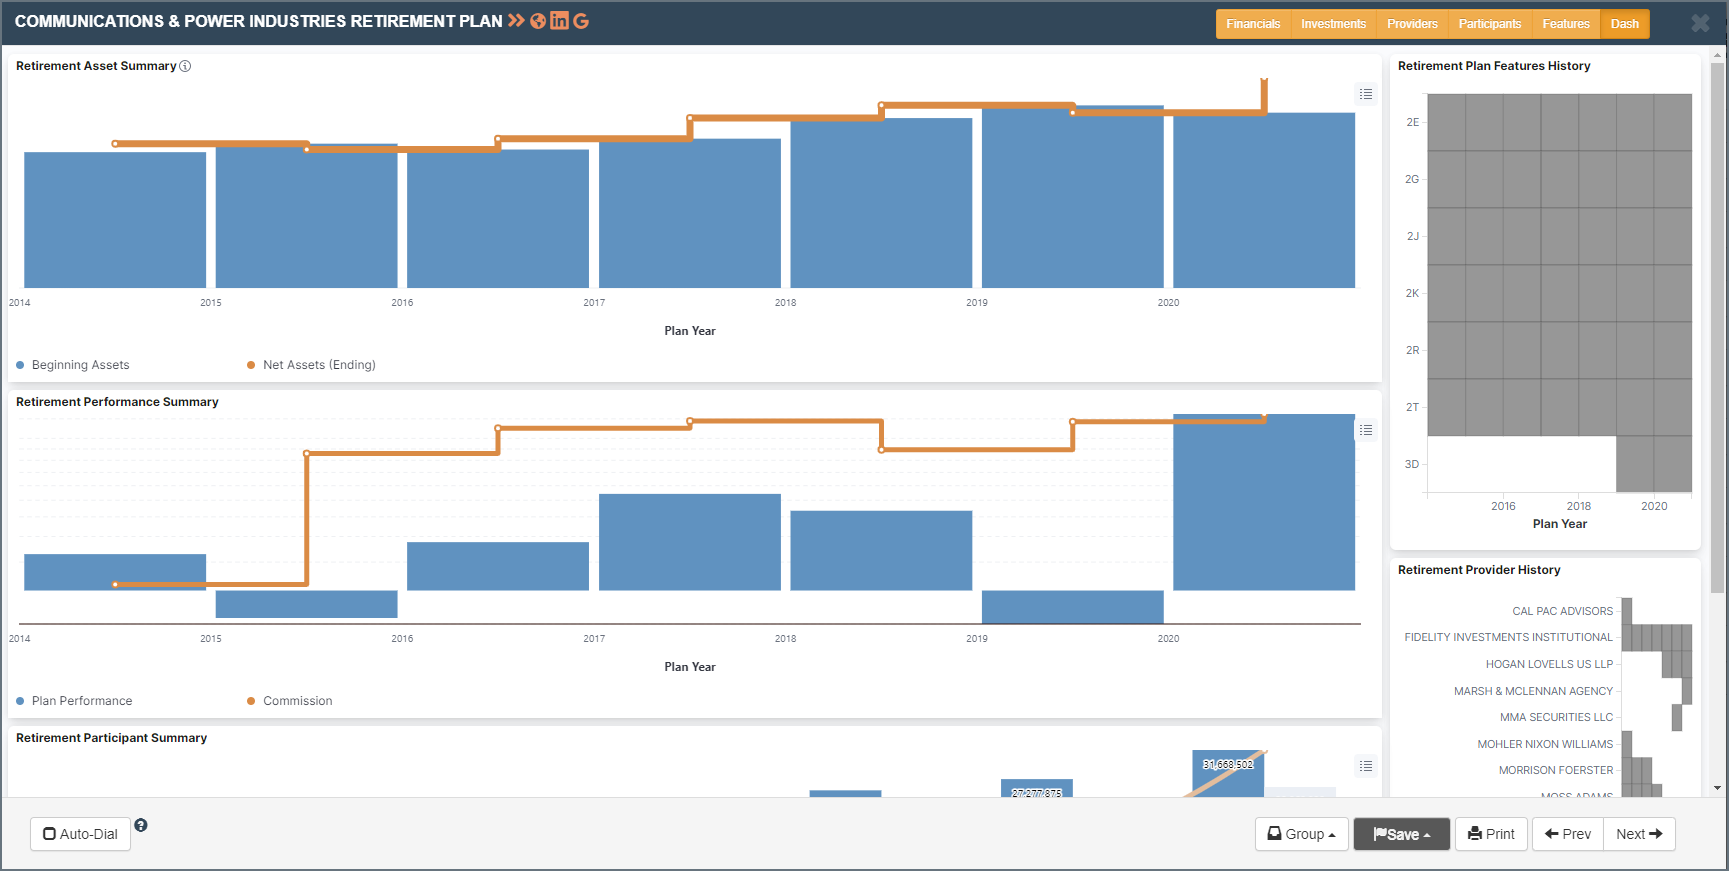
The Retirement Dash summarizes Assets, Performance & Commission, Participation, Feature and Provider history.
Asset Summary

This chart compares beginning and ending assets. Hovering over a term will provide a tooltip with the hard numbers. If the line is above the bar, the plan is growing, if below shrinking.
Performance Summary

This chart compares overall plan performance with compensation over time. Note that commission does not include basis point compensation, only dollar amount fees.
Participant Summary

This chart breaks down employee and employer contributions, active and retired participants, and benefits paid.
Plan Feature & Provider History

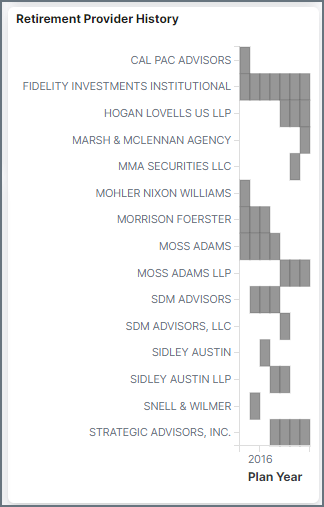
Both are historical matrixes, meaning if the cell is filled in, the feature or provider was active for that term. Due to size constraints and formatting, the term years are hidden. The column on the right is the most current term.